Top indicators for forex trading and how to use them

Moving Averages
Moving Averages (MAs) are used to identify trends and smooth out price action. Two common types include:
Simple Moving Average (SMA): Average prices over a specified period, giving equal weight to each data point.
Exponential Moving Average (EMA): Gives more weight to recent prices, making it more responsive to price changes.
Moving averages trading helps determine overall trend direction, but can also be used as support and resistance.
Using MAs for Trend Analysis
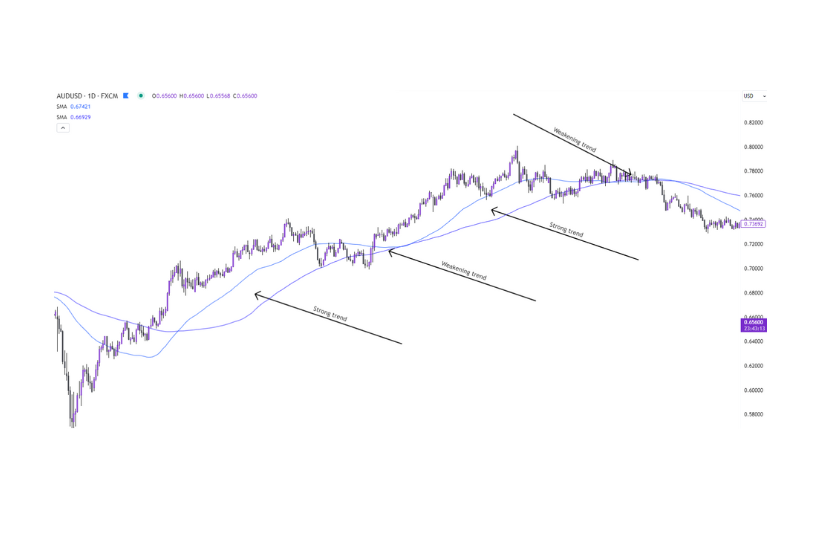
The 50-day and 100-day simple moving averages are widely used by traders around the world. As a rule of thumb, the wide the delta between two moving averages, the stronger the trend, as shown in Figure 1 below.

Figure 1 – Examples of a strong and weakening trend using the 50sma and 100sma.
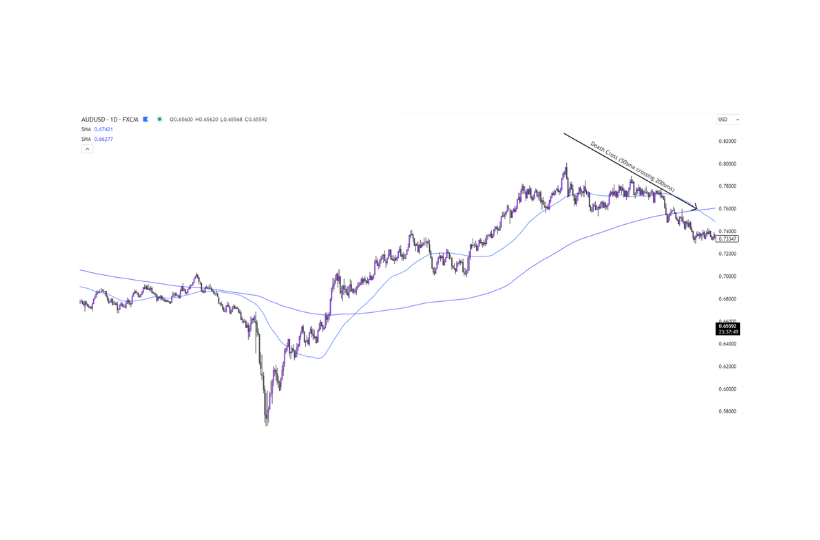
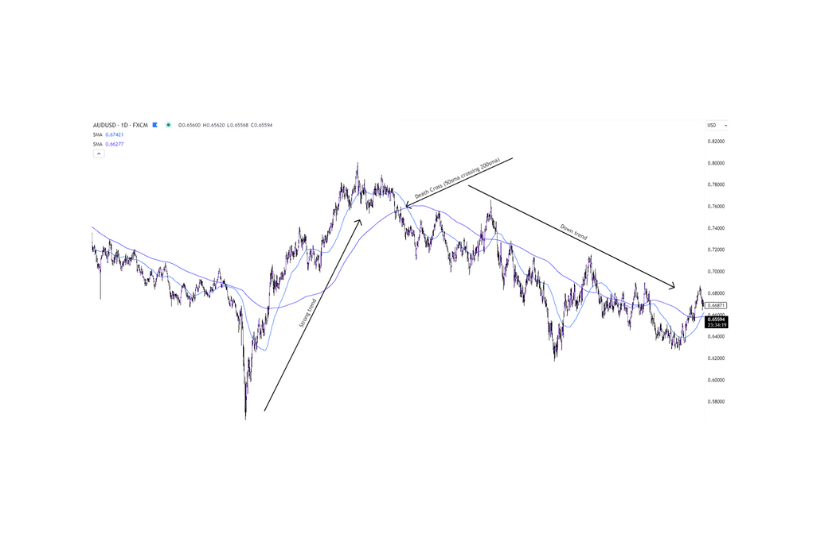
Another commonly-used moving average is the 200-day SMA. When combined with the 50-day moving average, traders keep a close eye out for a ‘Golden Cross’, or ‘Death Cross’, when the 50sma crosses above, or below the 200sma. This pattern has a history of identifying a possible reversal after a strong trend.

Figure 2a – example of a ‘Death Cross’ on the AUDUSD daily chart.

Figure 2b – the resulting change in trend direction.
Using MAs for Support & Resistance
Some traders use MAs as support and resistance levels for entering, and exiting trades. This method works on all timeframes but is most commonly used for intraday trading. For example, Figure 3 highlights a number of support and resistance points using the 50, 100, and 200 SMA’s on the 15min chart of EURUSD;


